01
A campus-first map
Structures, pathways and cables in one place. Find an asset by name, then see how it fits into the campus.
Campus fiber. Complete clarity.
Know what’s underground, what’s available, and what’s at risk—with campus fiber mapping built for universities.
Your campus. Your server. Your data.
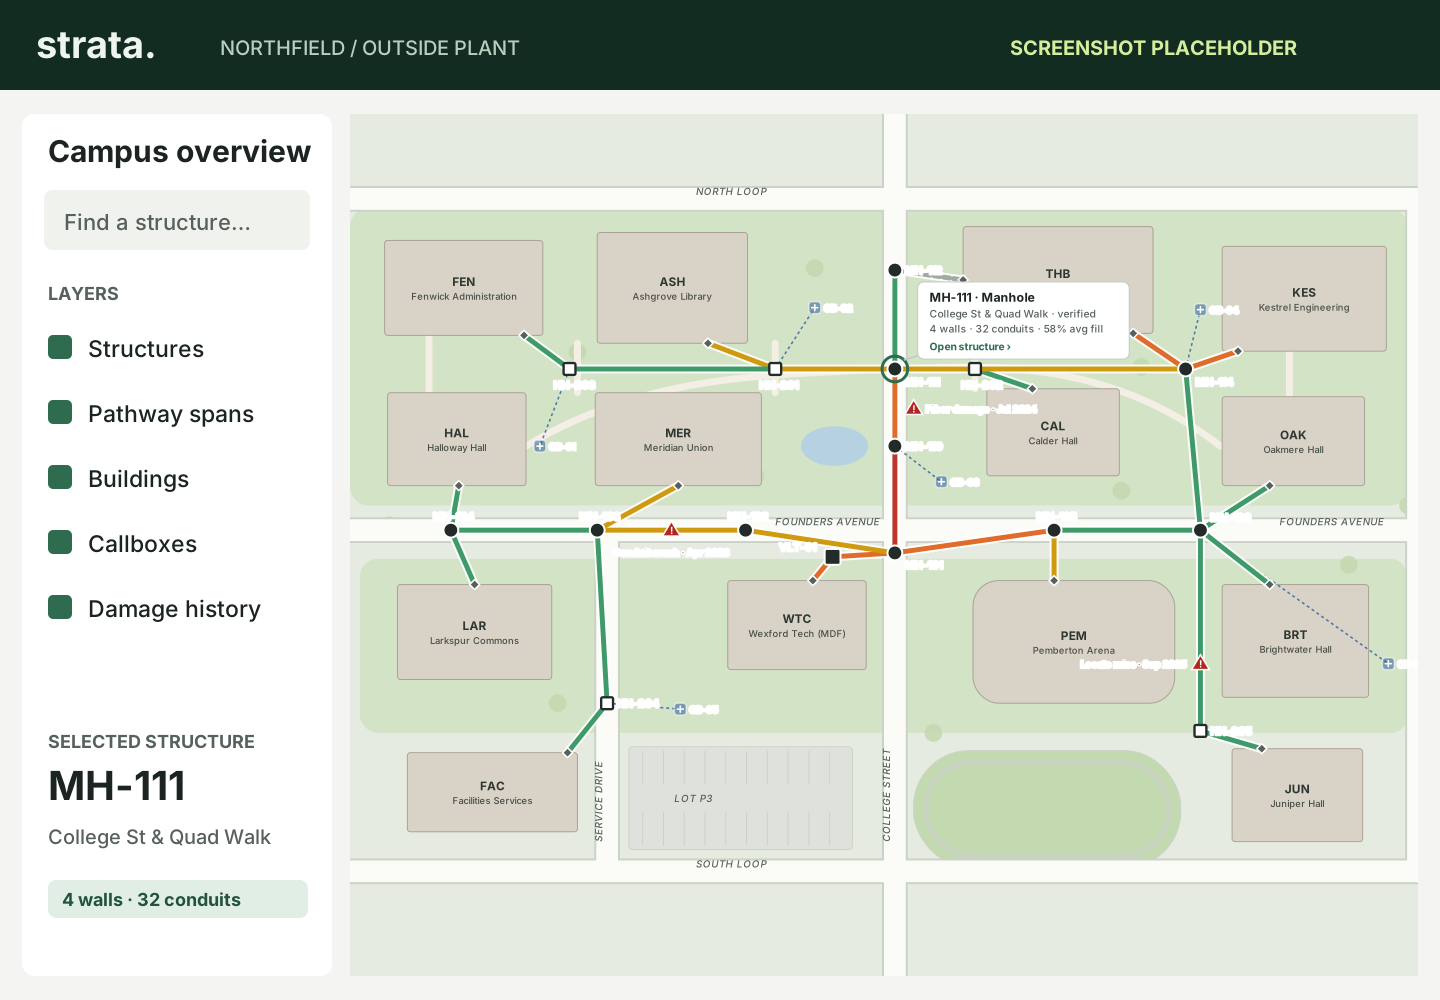
Campus scale. Strand-level detail.
Self-hosted. On your own server.
$299. Per campus, per year.
The whole outside plant
From the first locate to the next backbone pull, give every team the same picture of your physical network.
Structures, pathways and cables in one place. Find an asset by name, then see how it fits into the campus.
Open a duct wall. Inspect a cable. See dark, reserved and damaged strands, with capacity recorded per span.
Select a span to see predicted impact on circuits, buildings and callboxes. Understand what could go down before decisions go out.
Follow recorded strands, splices and terminations from end to end. Spot shared routes and records that still need verification.
Pull up a structure on your phone. Add photos and notes, work offline, and keep pending uploads separate from saved records.
Run Strata on your own infrastructure. Keep the plant record where it belongs: under your campus’s control.
Follow the detail
Turn “we think there’s spare fiber” into a record you can inspect. Then follow the connections to understand the consequences.
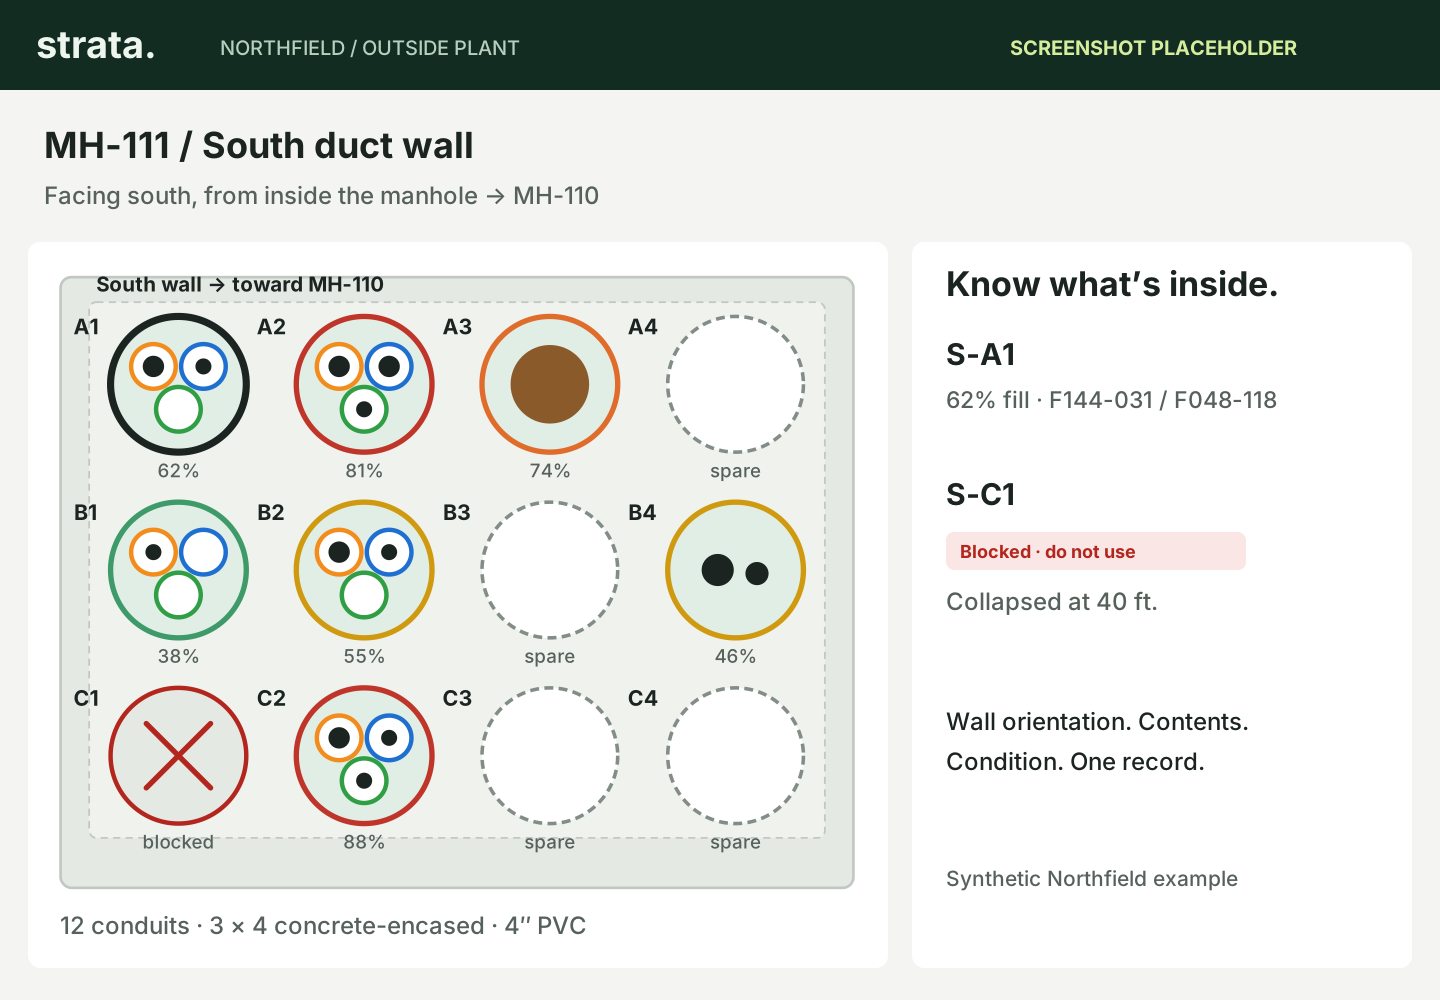
Inspect the physical plant
Wall orientation, conduit contents and condition, together. Local spare capacity is a starting point; end-to-end availability needs a trace.
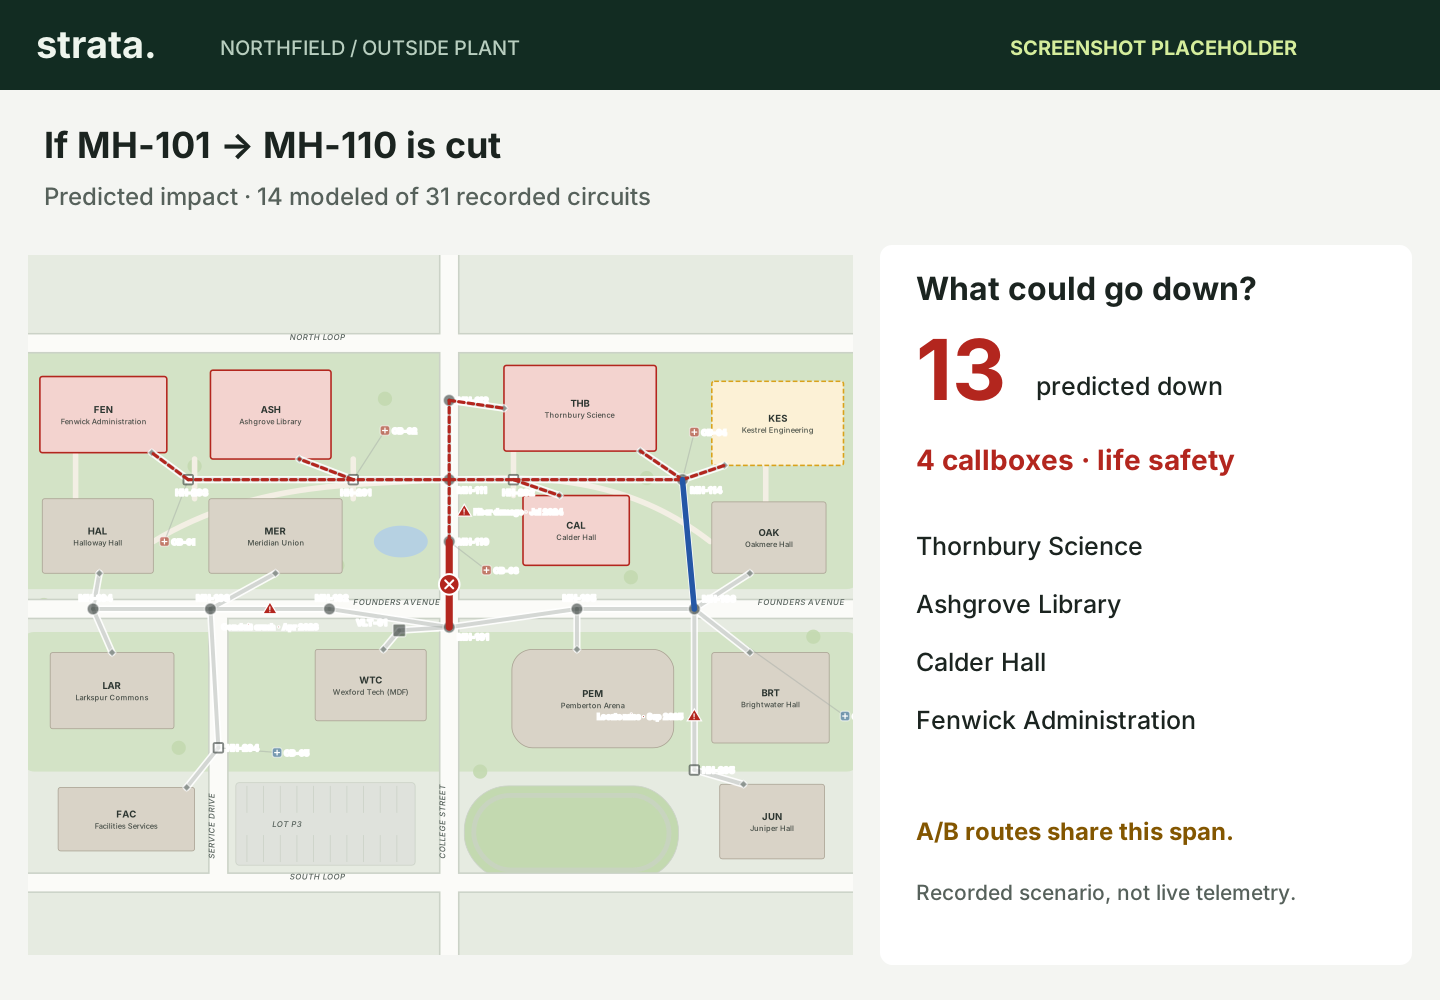
See the consequences
Find affected services and shared routes without piecing together separate files. Predicted impact follows your records; it is not live outage telemetry.
Start with what you have
Your existing map is the starting point. Review it before making it the record.
Bring in the structures and pathways you’ve already mapped.
Check classifications, resolve conflicts and flag what needs a field visit.
Give your team a shared campus map. Add detail as the record grows.
Beyond the desk
A phone. A manhole. The information you need, right where the work happens.
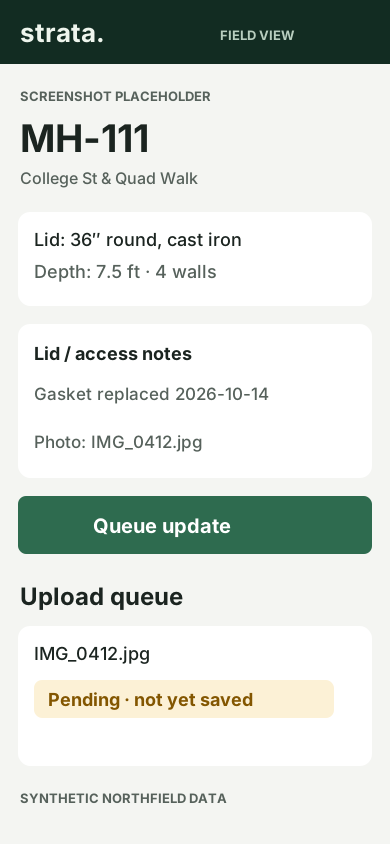
Campus infrastructure stays on campus
One campus. One tier.
One annual license for your campus. A straightforward price for a clearer picture of your outside plant.
The Strata campus license
$299/ campus / year
One tier · per campus · billed annually
LicensesIf your license lapses, Strata becomes read-only. You keep access to your data. Never locked out.
See the connections for yourself